
Levels of the Day

Today’s Levels of the Day post will focus largely on the bond market, specifically on the long-end of the curve in the UK and the US. Additionally, given its robust run higher, Spot Silver has also made today’s release!
UK 30-year GILT yield
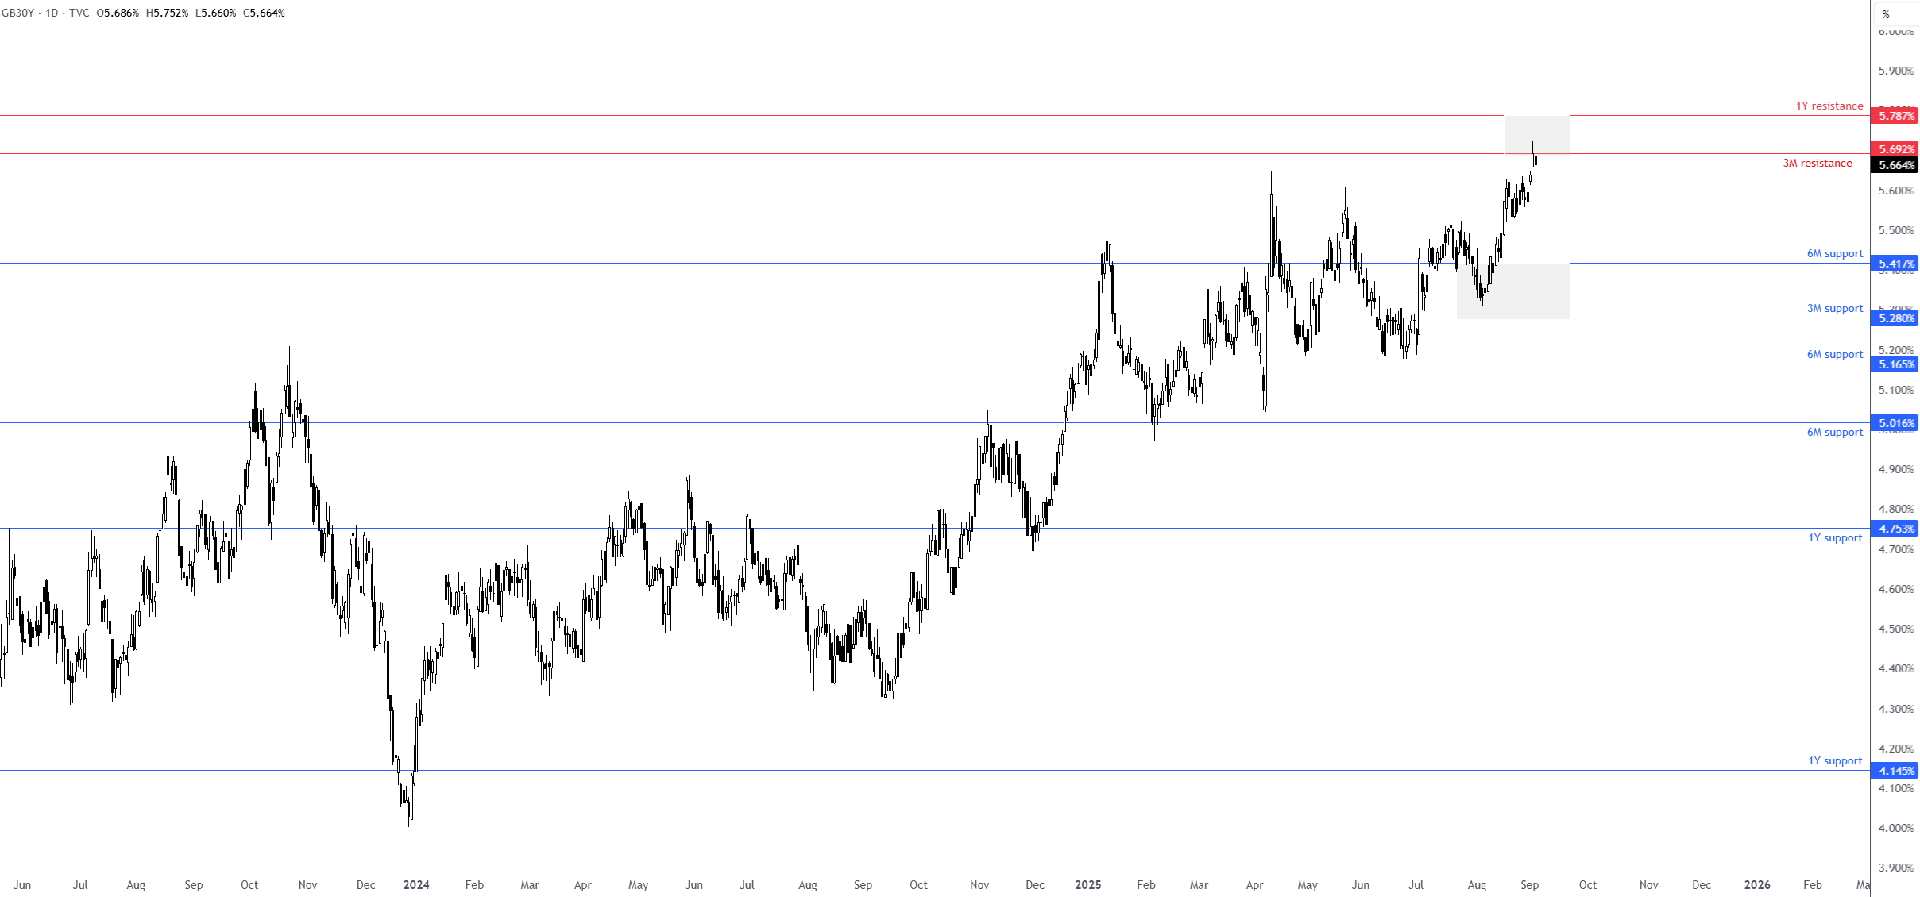
After long-term UK government borrowing costs jumped to a high of 5.752% (30-year yield), a level not seen since as far back as 1998, technical price action has tested an area of resistance between 5.787% (1Y) and 5.692% (3M). Supporting this resistance zone, we can see that price is on track to end today in the form of a bearish pin bar.
After long-term UK government borrowing costs jumped to a high of 5.752% (30-year yield), a level not seen since as far back as 1998, technical price action has tested an area of resistance between 5.787% (1Y) and 5.692% (3M). Supporting this resistance zone, we can see that price is on track to end today in the form of a bearish pin bar.
If bears maintain their position at current levels, a support area between 5.280% (3M) and 5.417% (6M) is seen.
US 30-year Treasury yield
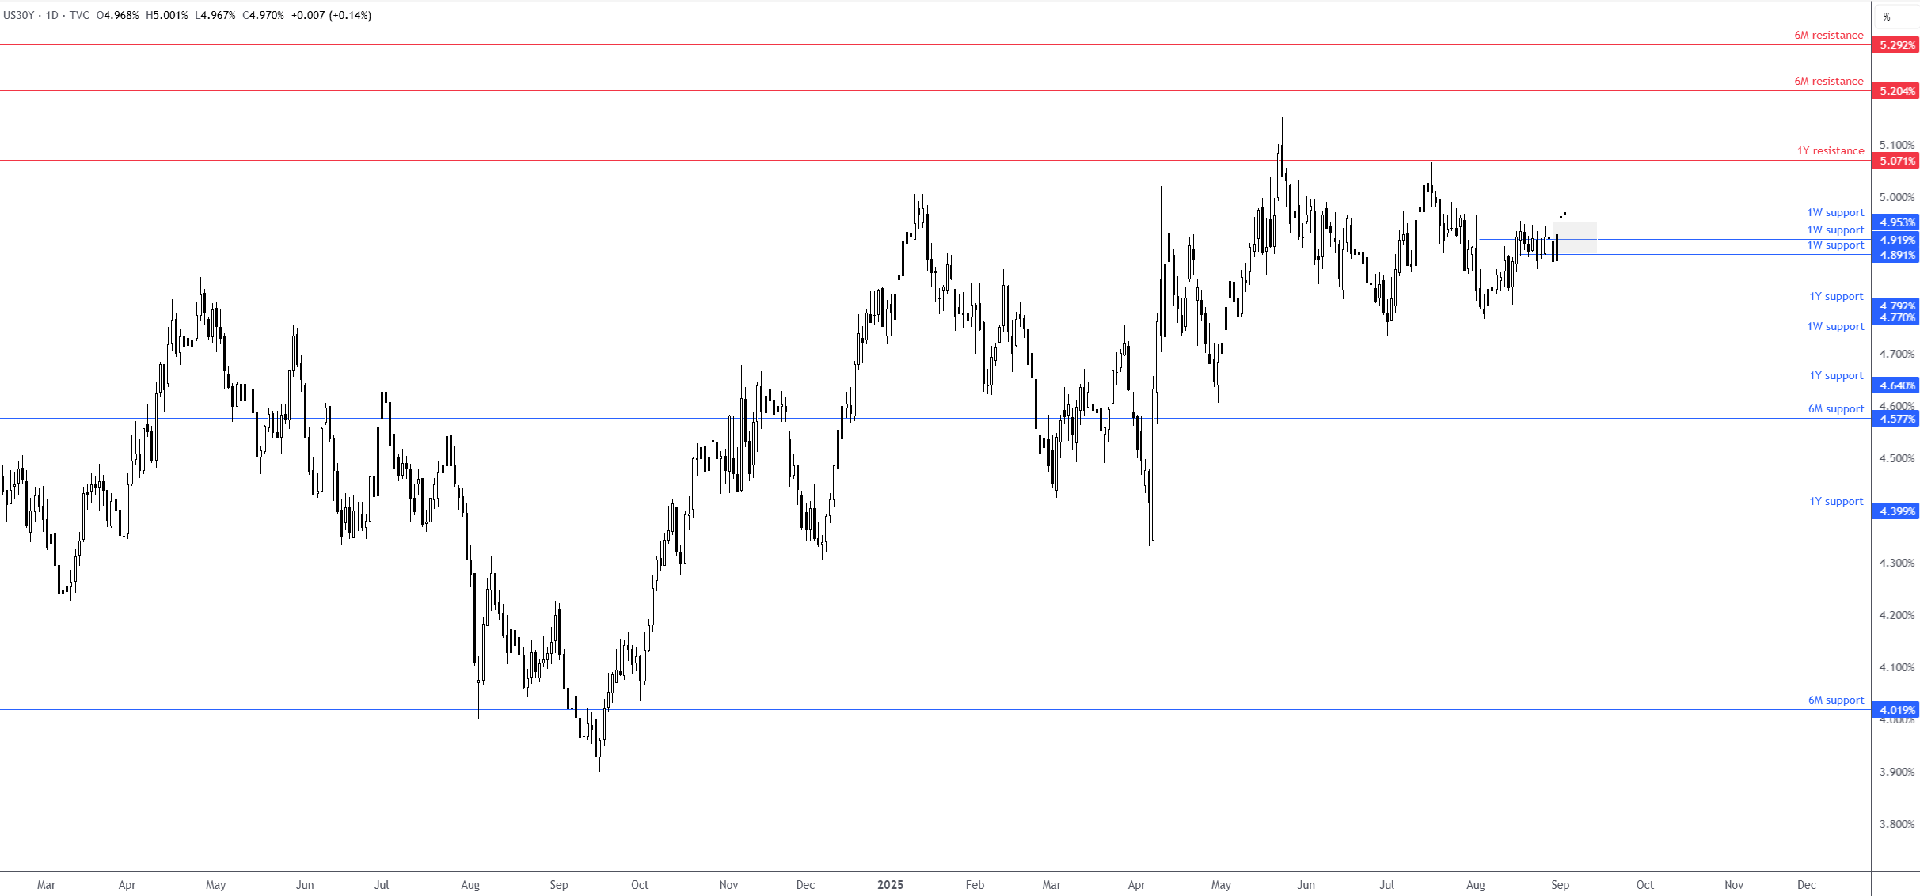
As shown in the chart below, price action recently manoeuvred above several 1W resistance levels, and price is now dealing with a support zone between 4.891% and 4.953%.
As shown in the chart below, price action recently manoeuvred above several 1W resistance levels, and price is now dealing with a support zone between 4.891% and 4.953%.
An absence of resistance overhead until the 1Y level at 5.071% suggests room for a push higher in this market. If price were to move north of this level, then the runway appears reasonably clear until another 6M resistance level coming in at 5.204%, an area not visited since 2007!
XAG/USD (Spot Silver versus the US dollar)
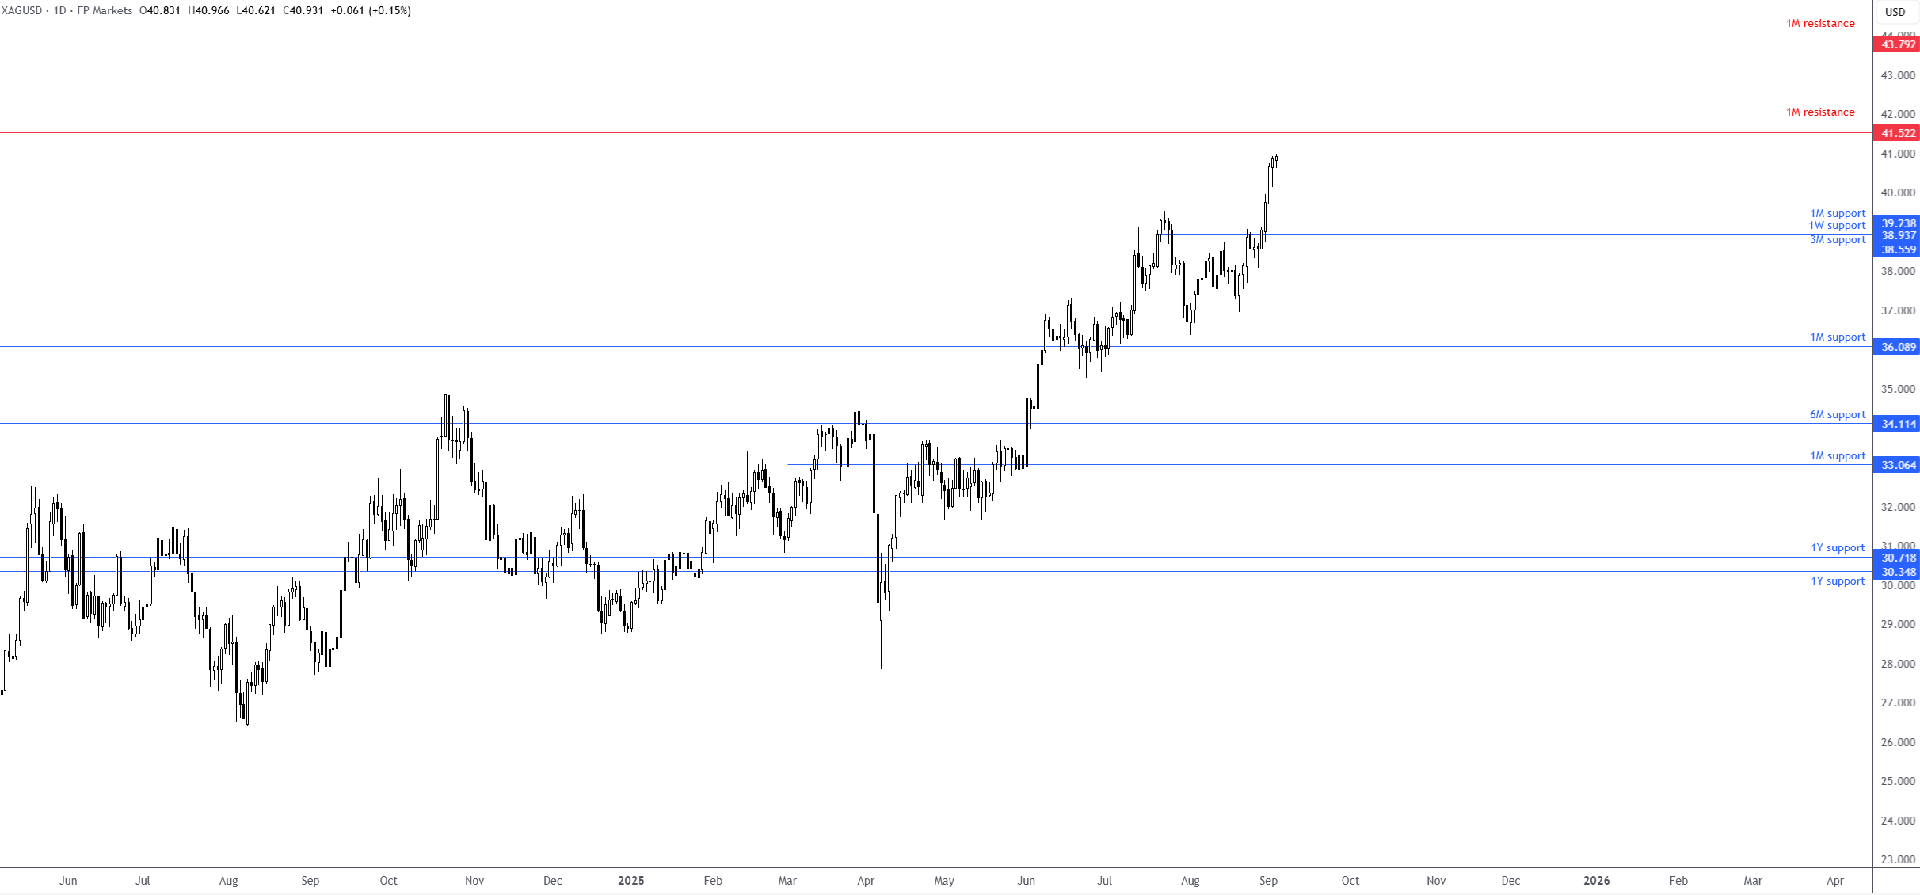
Spot Silver has been on a tear of late, recently hitting a high of US$40.97 and touching levels not seen since 2011. Ahead, you can see a 1M resistance at US$41.52, with a meaningful break of this level potentially throwing light on the 1M resistance level of US$43.79.
Spot Silver has been on a tear of late, recently hitting a high of US$40.97 and touching levels not seen since 2011. Ahead, you can see a 1M resistance at US$41.52, with a meaningful break of this level potentially throwing light on the 1M resistance level of US$43.79.
Ultimately, like Spot Gold (XAU/USD), which recently clocked fresh all-time highs, Spot Silver remains a buyers’ market for now. Therefore, should a correction materialise from current levels and price test support between US$38.56 and US$39.24 (made up of 3M, 1M, and 1W levels), this could draw in dip buyers. Alternatively, a breakout above US$41.52 may trigger follow-through buying towards US$43.79.
Charts created using TradingView
Written by the FP Markets Research Team
Publication date: