The pattern pulse – 21 May 2025

The FP Markets research team scans the financial markets for you, highlighting clear and actionable technical structures.
Forex: EUR/USD resistance calls for attention
Daily timeframe:
Daily timeframe:
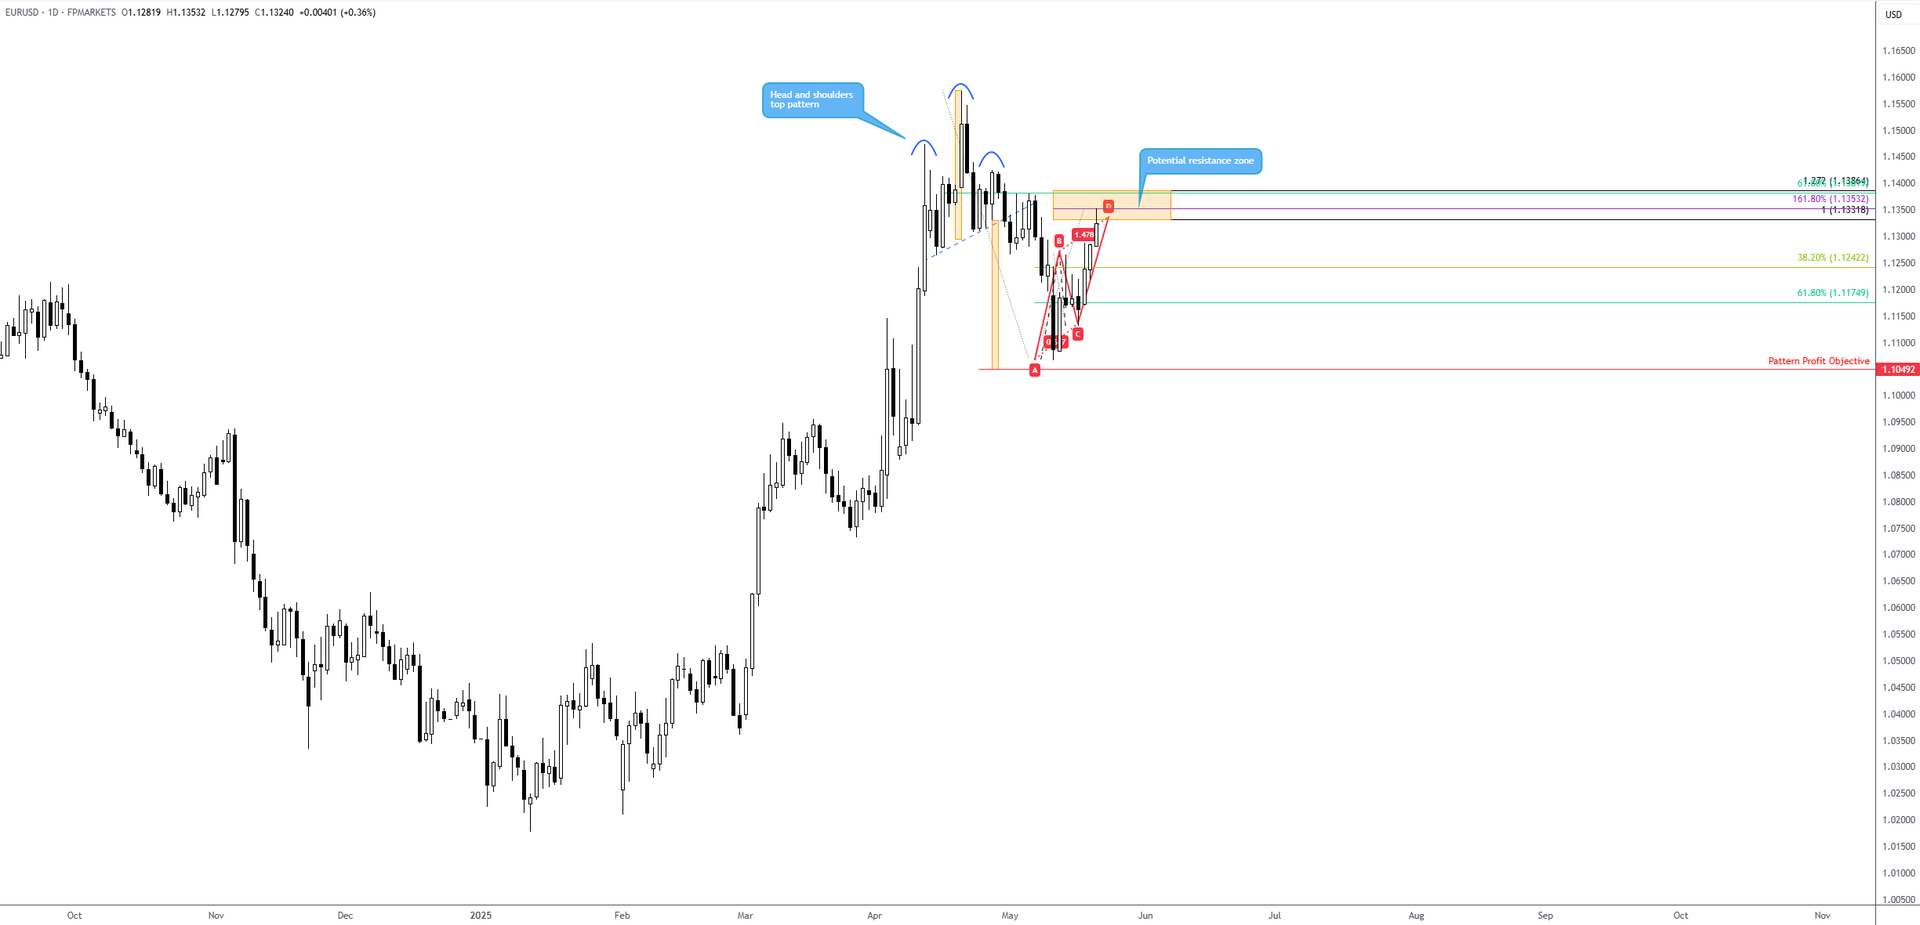
Following the EUR/USD (euro versus the US dollar) trading within striking distance of a head and shoulders top pattern’s profit objective at US$1.1049, bulls went on the offensive. Consequently, as shown on the chart below, price has pencilled in an AB=CD bearish formation at US$1.1332, according to the 100% projection ratio and a 1.618% Fibonacci extension ratio of US$1.1353 (B-C reciprocal). However, in terms of a resistance zone, I would be inclined to include the 1.272% Fibonacci projection ratio at US$1.1386, which shares chart space with a 61.8% Fibonacci retracement ratio from US$1.1382.
Harmonic traders tend to target the 38.2% and 61.8% Fibonacci retracement ratios derived from the A-D legs, which, assuming a temporary peak in price at current levels, reside at US$1.1242 and US$1.1175, respectively.
Commodities: Clear support for Brent Crude
Monthly timeframe:
Monthly timeframe:
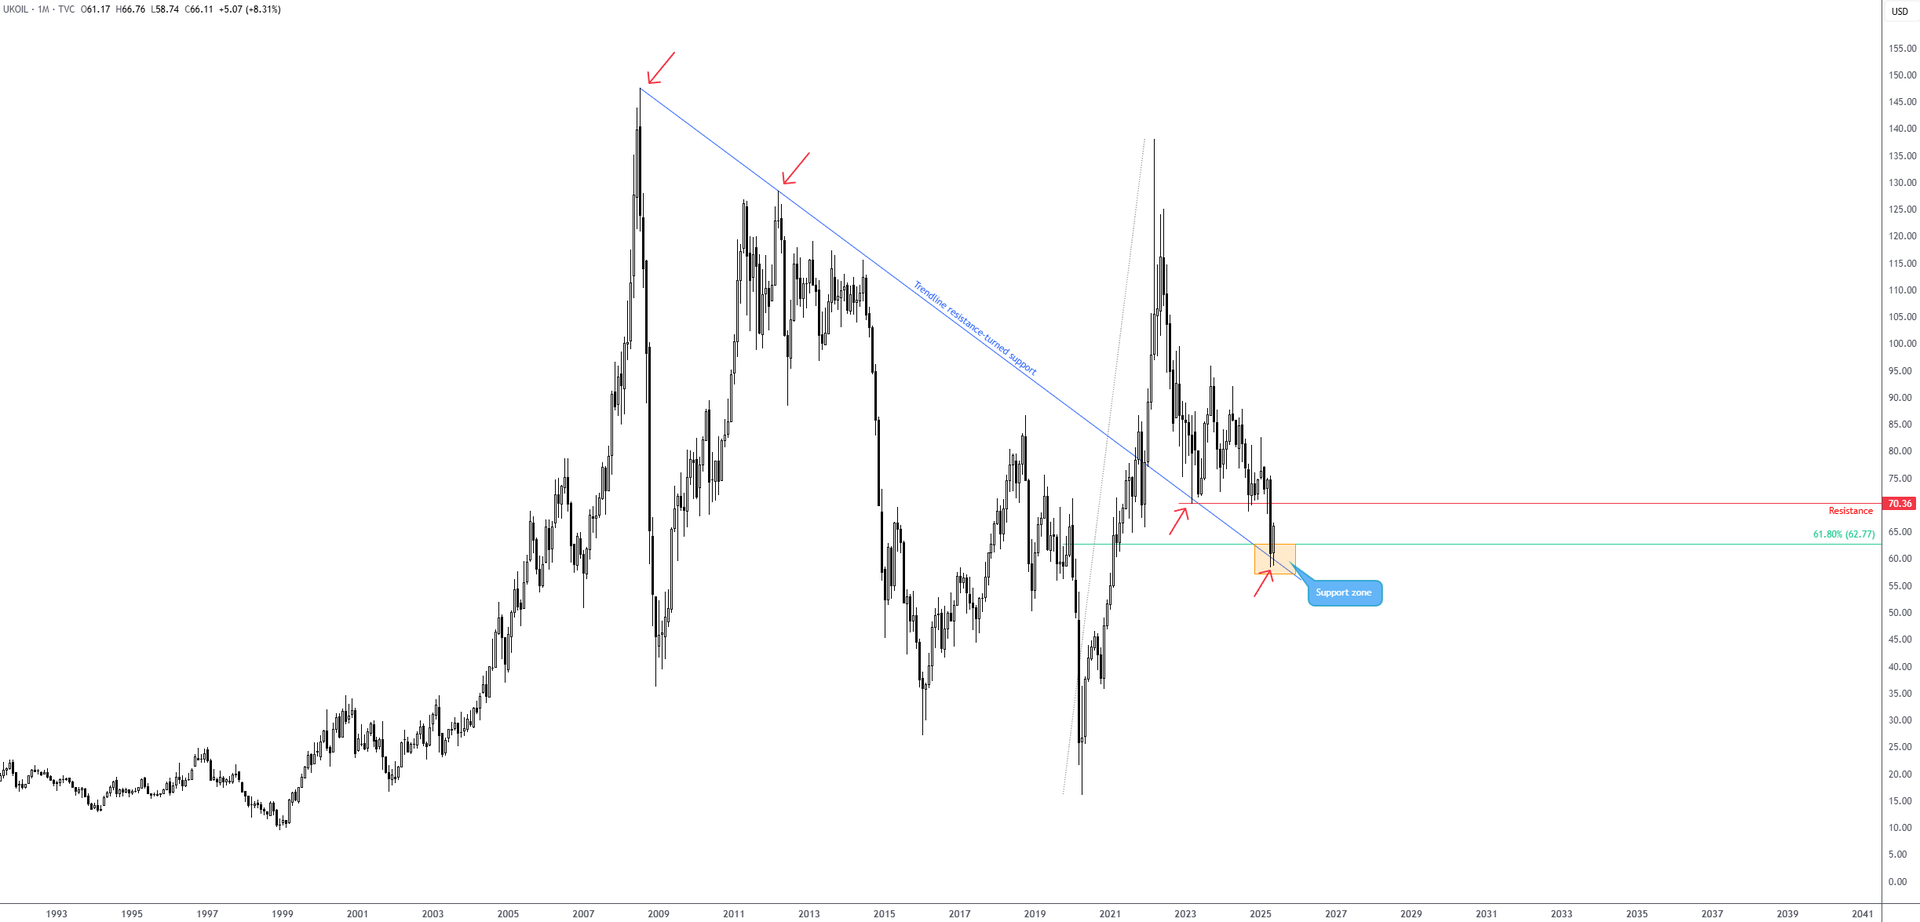
While Oil markets are bid on the back of recent reports of a potential Israel strike on Iran, long-term technical support is also in play on the monthly chart of Brent Crude (UKOIL). As shown below, trendline resistance-turned-support recently entered the fray around US$60.00, a descending line taken from the all-time high of US$147.50, and a 61.8% Fibonacci retracement ratio at US$62.77.
As a result, further buying may be seen towards monthly resistance coming in from US$70.36.
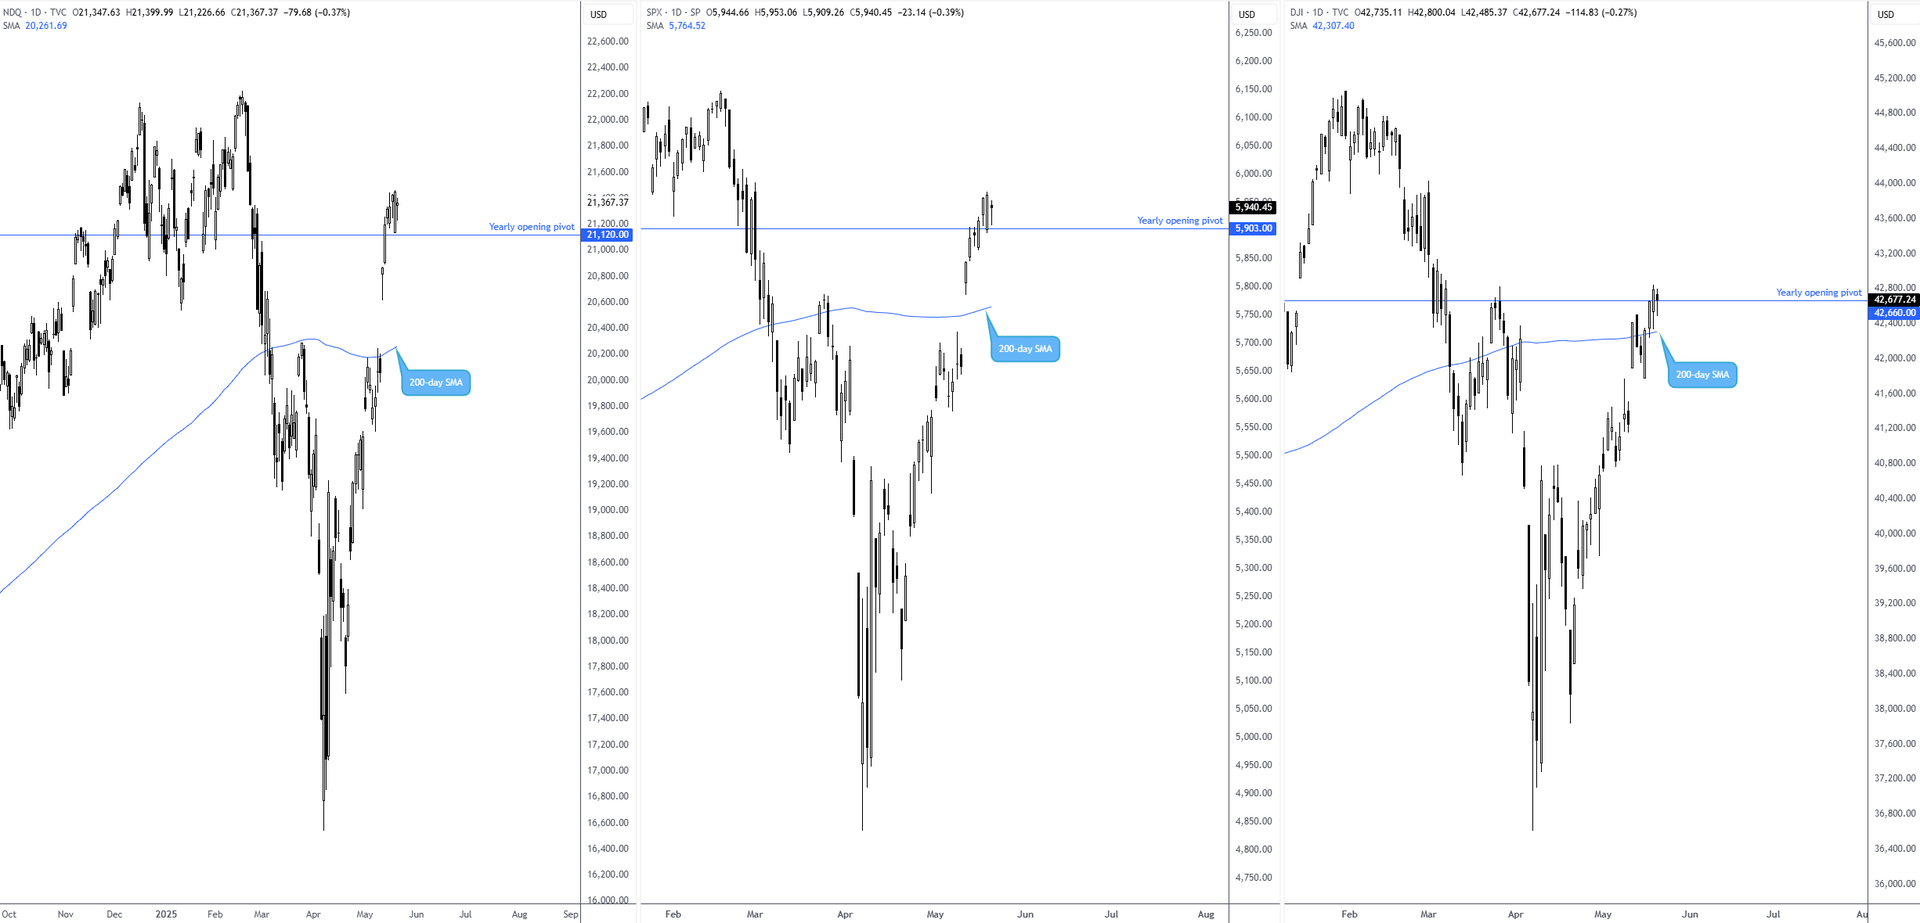
Equities: US equity indexes hovering north of 200-day SMAs
Daily timeframe:
Daily timeframe:
Following the announcement of the 90-day US-China trade truce, US equity markets have outperformed. This has pulled major US equity benchmarks north of the 200-day simple moving averages (SMAs) and seen price manoeuvre into positive territory.
Publication date: