The Pattern Pulse – 24 October 2024

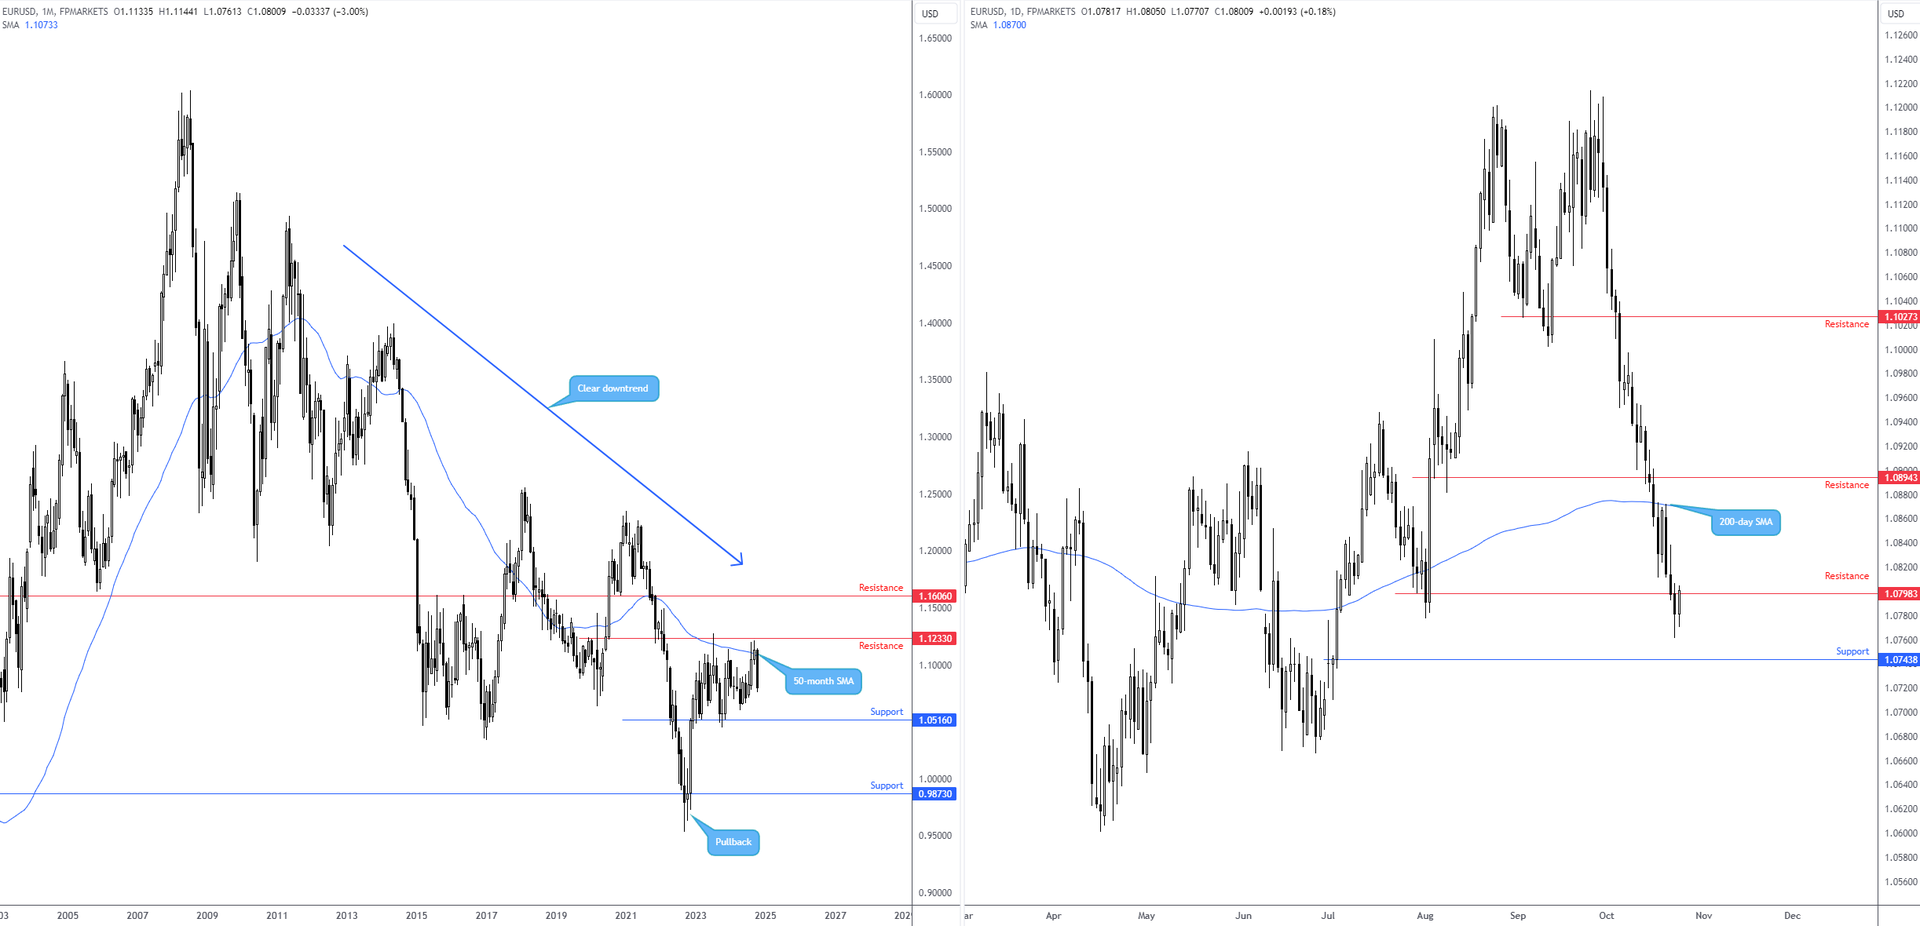
Forex: EUR/USD Still on the Ropes
Monthly/Daily Timeframes:
Monthly/Daily Timeframes:
Europe’s shared currency continues to trade on the back foot versus its US counterpart, down more than 3.0% month to date. Interestingly, further underperformance is within view based on the monthly chart demonstrating scope to push as far south as support from US$1.0516. In addition, price action on the daily scale stepped beneath support at US$1.0798 (now being retested as potential resistance) and unfastened the door to support from US$1.0744.
Given the above analysis, EUR/USD bears may remain at the wheel for the time being.
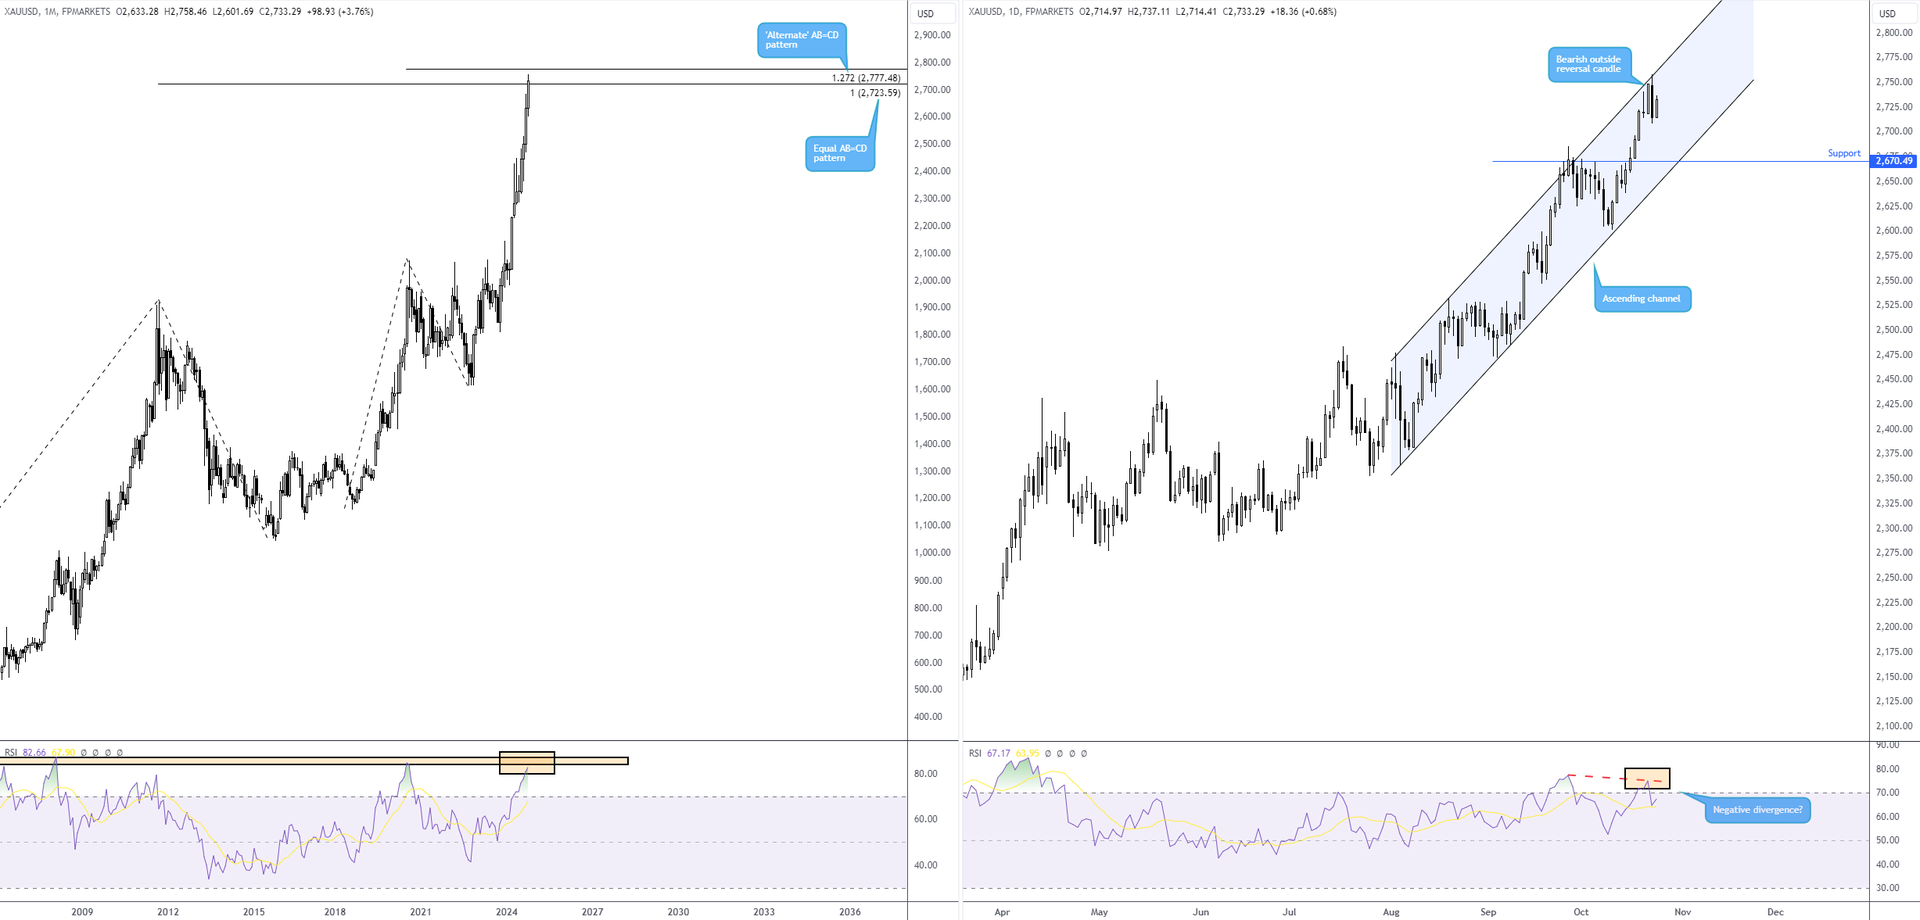
Commodities: Trouble Ahead for Gold?
Monthly/Daily Timeframes:
Monthly/Daily Timeframes:
Gold (XAU/USD) has powered higher this year, climbing 34% year to date and recently refreshing all-time highs of US$2,758. The precious metal is also on track to pencil in its largest one-year gain in 14 years. As you can see from the chart below, despite the trend favouring buyers, resistance is in play on monthly and daily timeframes.
The monthly chart’s Relative Strength Index (RSI) is closing in on an area of resistance between 87.02 and 83.87, bolstered by the convergence of projection ratios at current price between US$2,777 and US$2,723. The daily chart also moulded a bearish outside day reversal candle from channel resistance yesterday (taken from the high of US$2,531). This was also accompanied by negative divergence from the RSI within overbought territory.
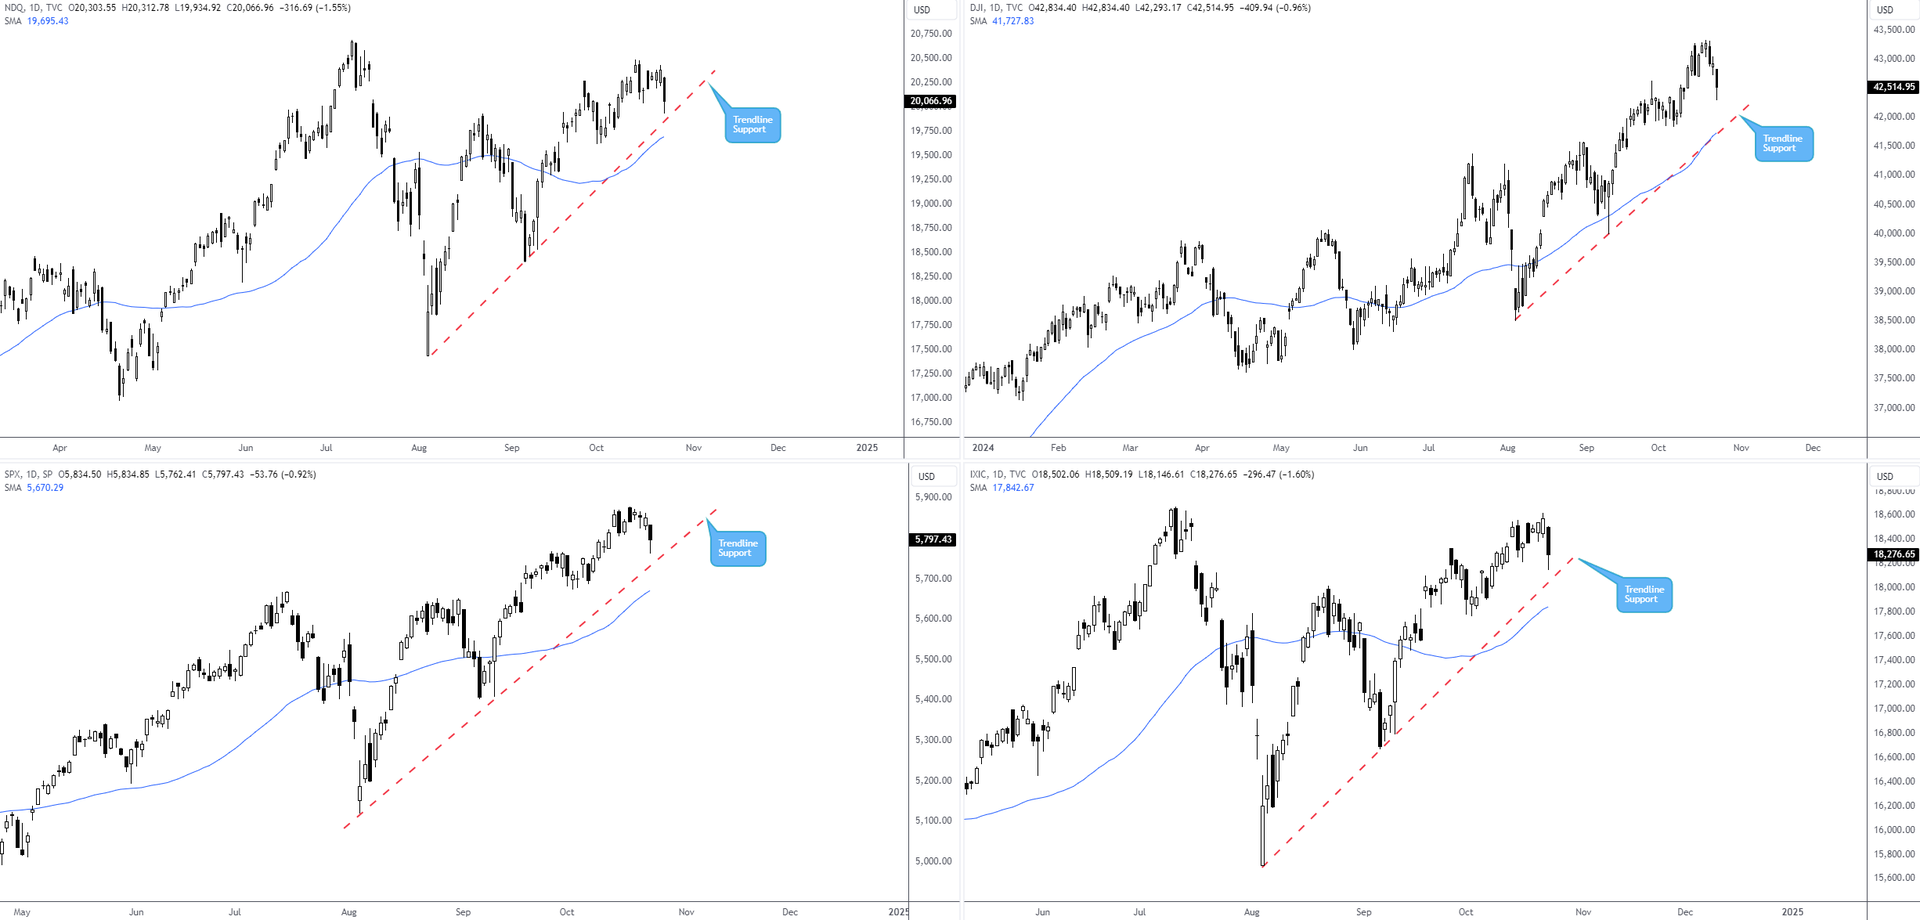
Equities: US Equities Nearing Trendline Support
Daily Timeframe:
Daily Timeframe:
Trendline supports are visible across key US market equity indices, with the Nasdaq 100 and Nasdaq Composite on the doorstep of testing their ascending lines. Assuming price respects these barriers, we could see the aforementioned indexes refresh all-time highs.
Both the S&P 500 and the Dow 30 are seen correcting from recent all-time highs of 5,878 and 43,325, respectively. Therefore, a test of their respective trendline supports could draw dip buyers to potentially engulf recent record highs.
Disclaimer:
DISCLAIMER: The information contained in this material is intended for general advice only. It does not consider your investment objectives, financial situation or particular needs. FP Markets has made every effort to ensure the accuracy of the information as at the date of publication. FP Markets does not give any warranty or representation as to the material. Examples included in this material are for illustrative purposes only. To the extent permitted by law, FP Markets and its employees shall not be liable for any loss or damage arising in any way (including by way of negligence) from or in connection with any information provided in or omitted from this material. Features of the FP Markets products including applicable fees and charges are outlined in the Product Disclosure Statements available from FP Markets website, www.fpmarkets.com and should be considered before deciding to deal in those products. Derivatives can be risky; losses can exceed your initial payment. FP Markets recommends that you seek independent advice. First Prudential Markets Pty Ltd trading as FP Markets ABN 16 112 600 281, Australian Financial Services License Number 286354.
Publication date: