
Levels of the Day

Euro versus the US dollar (EUR/USD)
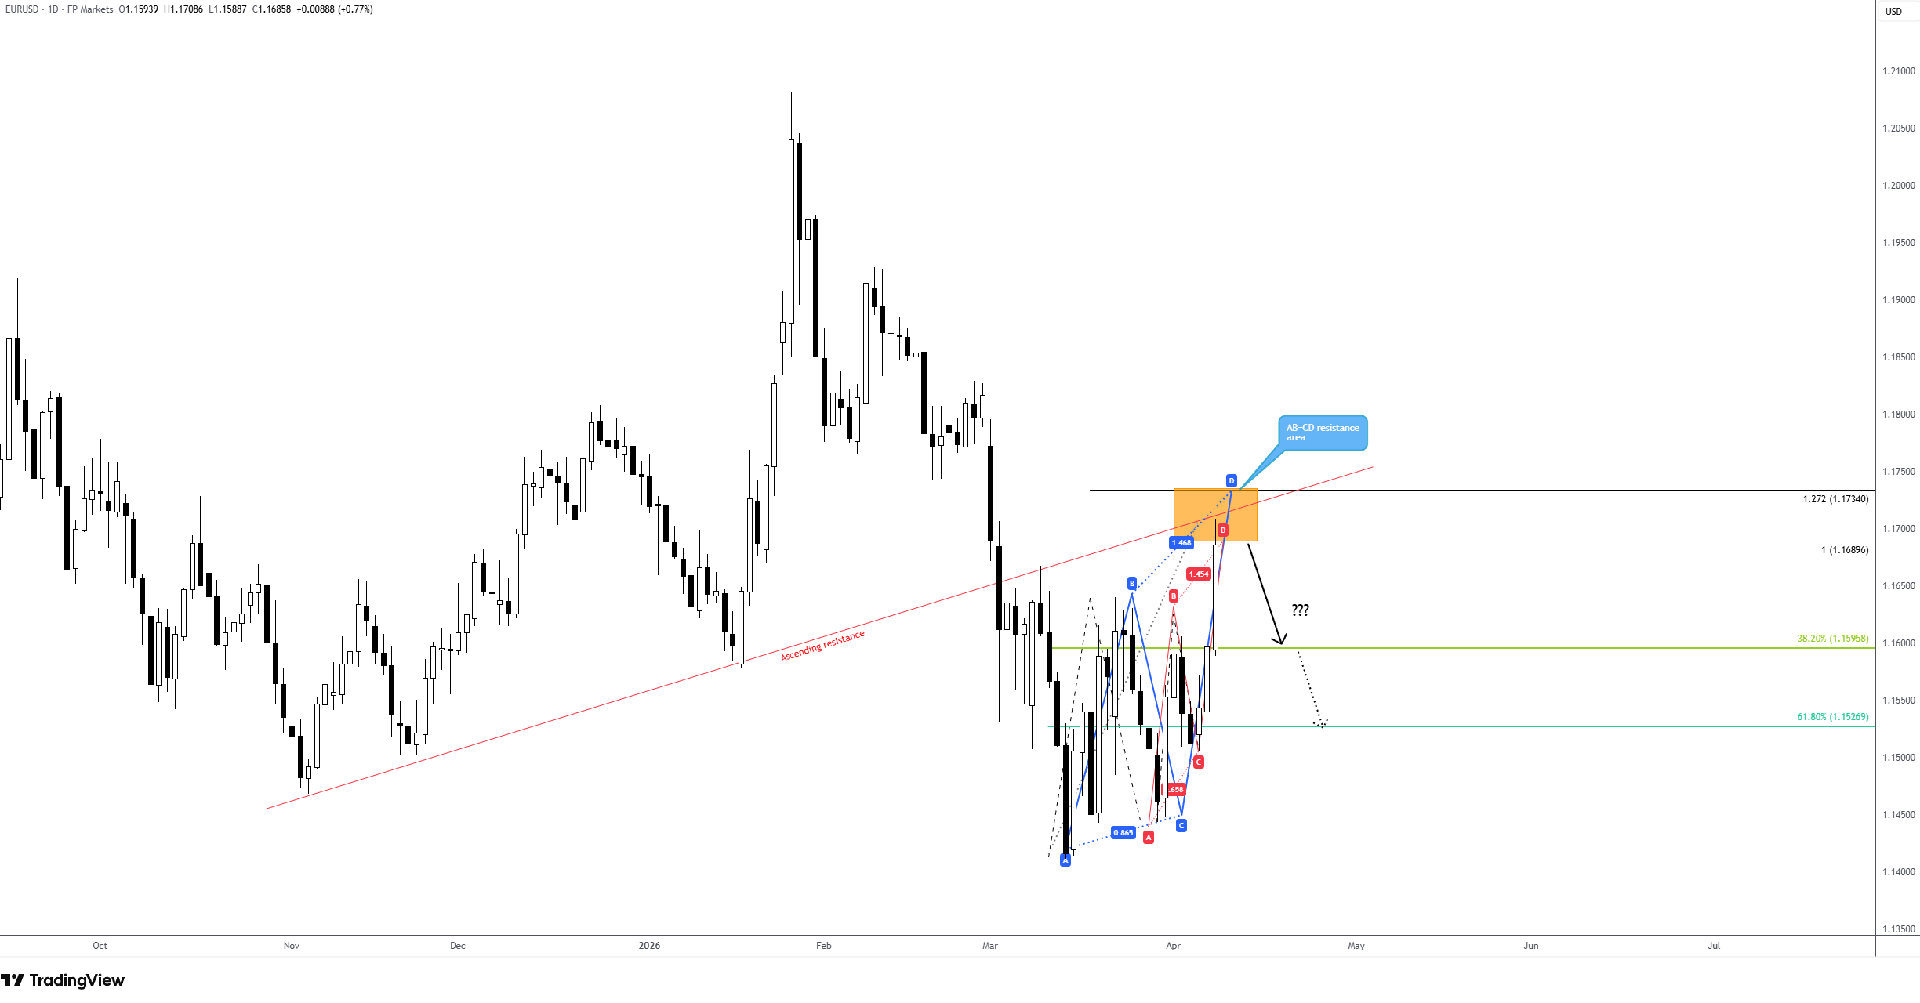
From the daily chart of the EUR/USD, the pair gained traction today amid a broad-based USD sell-off following the recent US-Iran ceasefire.
From the daily chart of the EUR/USD, the pair gained traction today amid a broad-based USD sell-off following the recent US-Iran ceasefire.
Technically, the unit is now shaking hands with a resistance zone between US$1.1734 and US$1.1690 – a base made up of a 1.272% Fibonacci projection and a 100% projection (AB=CD resistance levels). Complementing this area is an ascending resistance, taken from the low of US$1.1468.
Current AB=CD sellers will likely target the 38.2% and 61.8% Fibonacci retracements at US$1.1596 and US$1.1527, respectively, derived from legs A-D of the larger AB=CD pattern.
KOSPI (KRX)
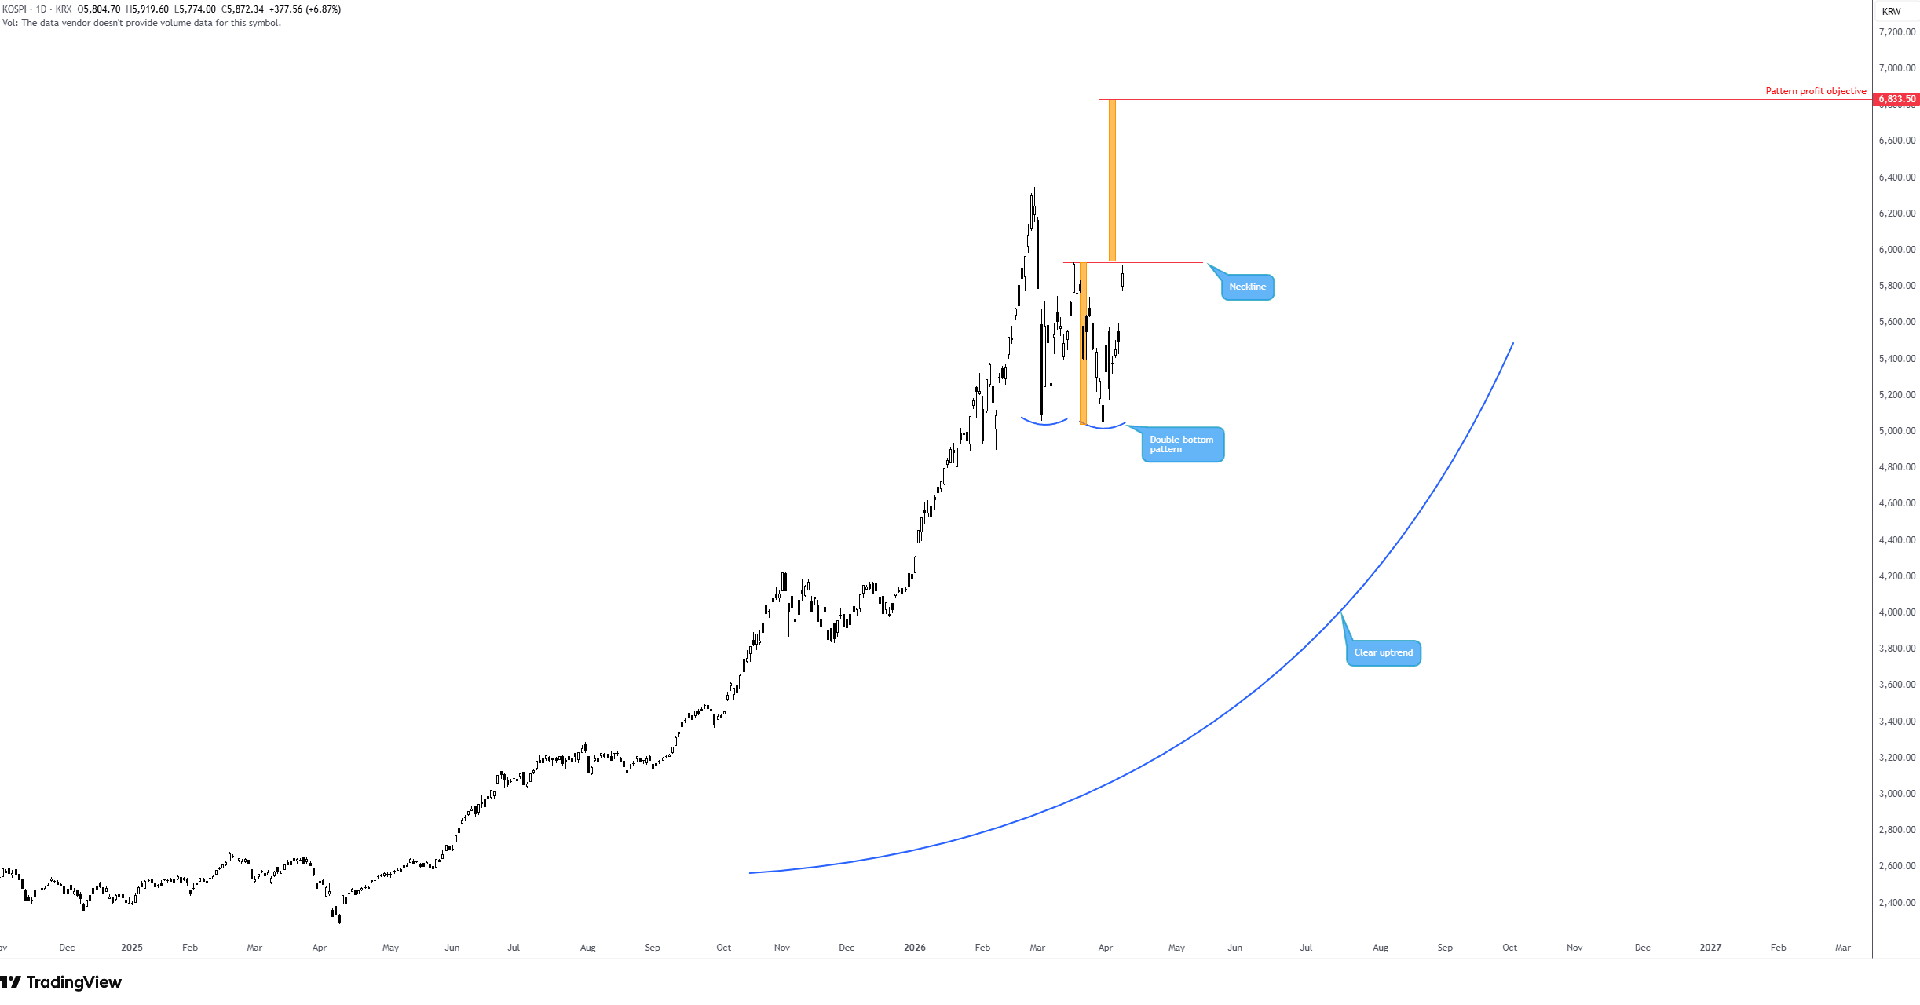
Asia Pac equities rallied strongly on the back of the news from the Middle East, with South Korea’s KOSPI adding nearly 7% by the close today. While the KOSPI’s moves are certainly eye-catching, the potential double-bottom pattern around 5,060 is equally interesting as price closes in on the neckline, extended from the high of 5,934.
Asia Pac equities rallied strongly on the back of the news from the Middle East, with South Korea’s KOSPI adding nearly 7% by the close today. While the KOSPI’s moves are certainly eye-catching, the potential double-bottom pattern around 5,060 is equally interesting as price closes in on the neckline, extended from the high of 5,934.
Engulfing the said neckline effectively completes the double-bottom pattern and will prompt chart pattern enthusiasts to plot a profit objective at 6,833, beyond the all-time high of 6,347. Overall, a break of 5,934 signals that breakout buyers could take the wheel.
Air France-KLM (AF)
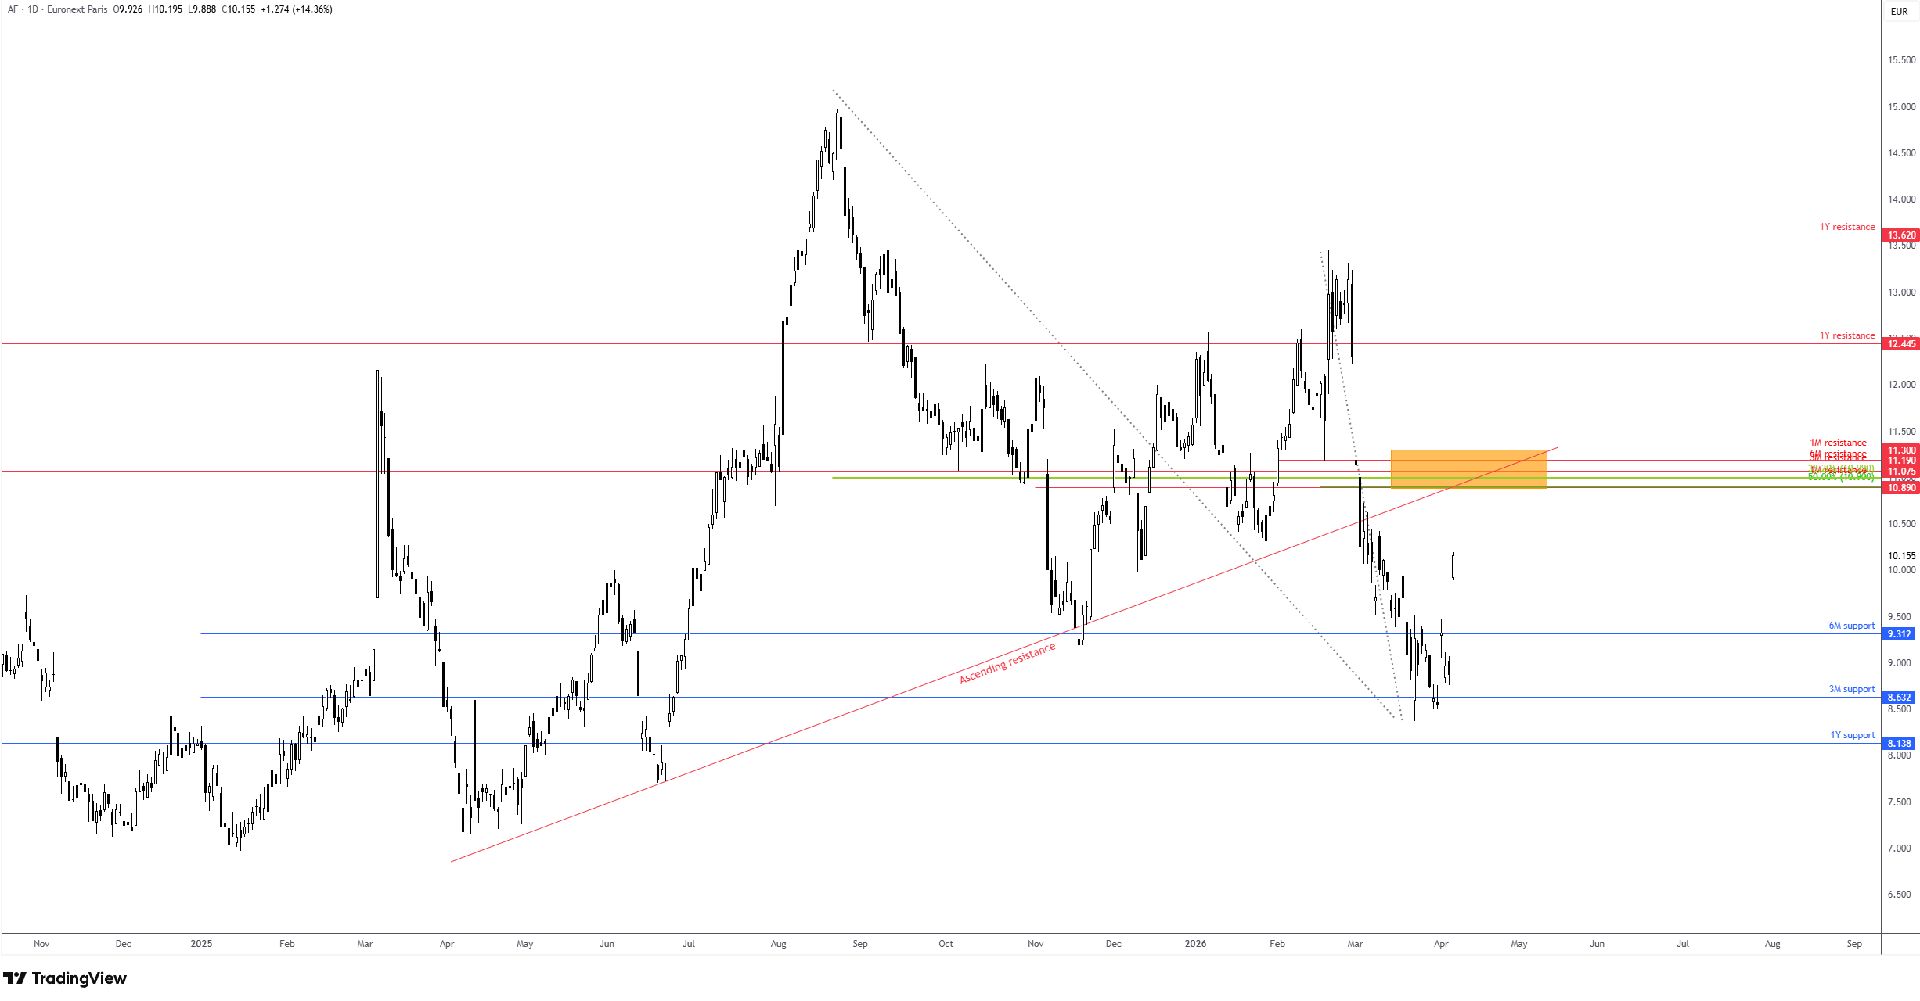
Airline stocks are clear beneficiaries of the US-Iran ceasefire, with the AF stock catching a meaningful bid today, up 14% as of writing.
Airline stocks are clear beneficiaries of the US-Iran ceasefire, with the AF stock catching a meaningful bid today, up 14% as of writing.
Interestingly, the technical picture indicates scope for further outperformance until a major resistance zone between US$11.30 and US$10.89. This is made up of 1M, 3M, and 6M resistance levels. Complementing this area is a 50.0% retracement, a 38.2% Fibonacci retracement, as well as an ascending support, taken from the low of US$6.90. Therefore, while bulls will likely remain in control, the said resistance could serve as a logical upside target, where sellers/profit taking could emerge.
Written by FP Markets Chief Market Analyst Aaron Hill
Publication date: